
December 20, 2025 · 1 min read
Visualizing Migration Patterns with Flow Maps
How to use Mapimator's route and region tools to show the movement of people, animals, or goods.
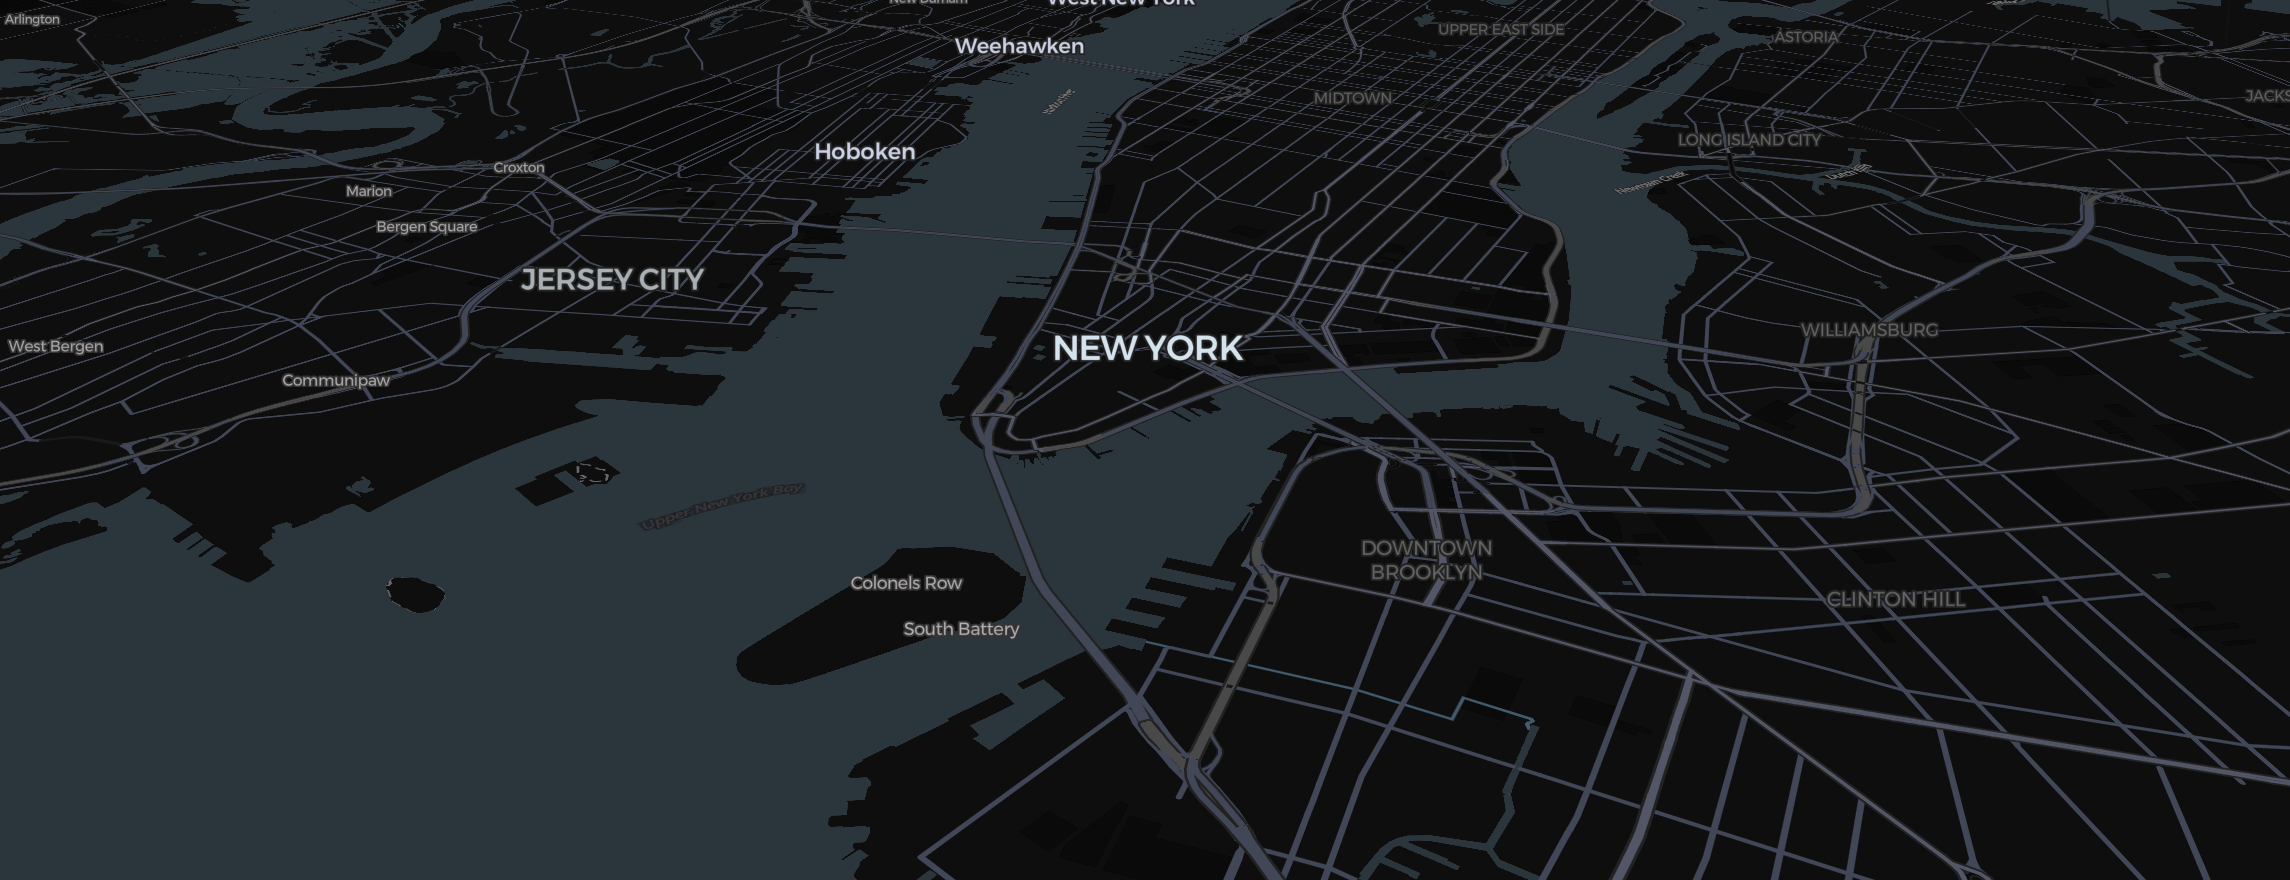
A "Flow Map" is a type of thematic map that shows the movement of objects from one location to another. Whether you’re mapping the migration of ancient ancestors or modern-day supply chains, Mapimator’s Studio provides the precision tools to build beautiful flow visuals.
Highlighting the Source and Destination
Use the Region tool to identify where the "flow" begins and ends.
- Source: Highlight in a neutral color (e.g., Light Gray).
- Destination: Highlight in a vibrant color (e.g., Orange or Teal).
- Set the fill Opacity to 30% to maintain context.
Animating the Flow
Instead of a single line, use the Route Tool to draw several parallel or branching paths.
- Set the Animation Type to Draw.
- Increase the Animation Duration to match your camera move. This creates a "growing" effect where the viewer sees the movement happen in real-time.
- For maritime flows, use Dashed lines to represent shipping lanes or bird migration corridors.
Pacing the Story
In your Storyboard, use the Title feature to label the timeline (e.g., "Phase 1: Departure," "Phase 2: Transition").
- Set the Easing to Smooth for a steady, calm, and informative pace.
- Check out our guide on Typography Halo to ensure your labels are readable over complex migration maps.
To ensure your final data visualization is crisp for a presentation or a lecture, always let the Studio finish its rendering preparation when you export the final video (up to 4K on Pro).