
January 9, 2026 · 1 min read
Mapping the Middle East: Visualizing Complex Conflicts
How to use Mapimator's region and label tools to create clear, informative geopolitical explainers.
By Mapimator Editorial#Geopolitics#News#Tutorial
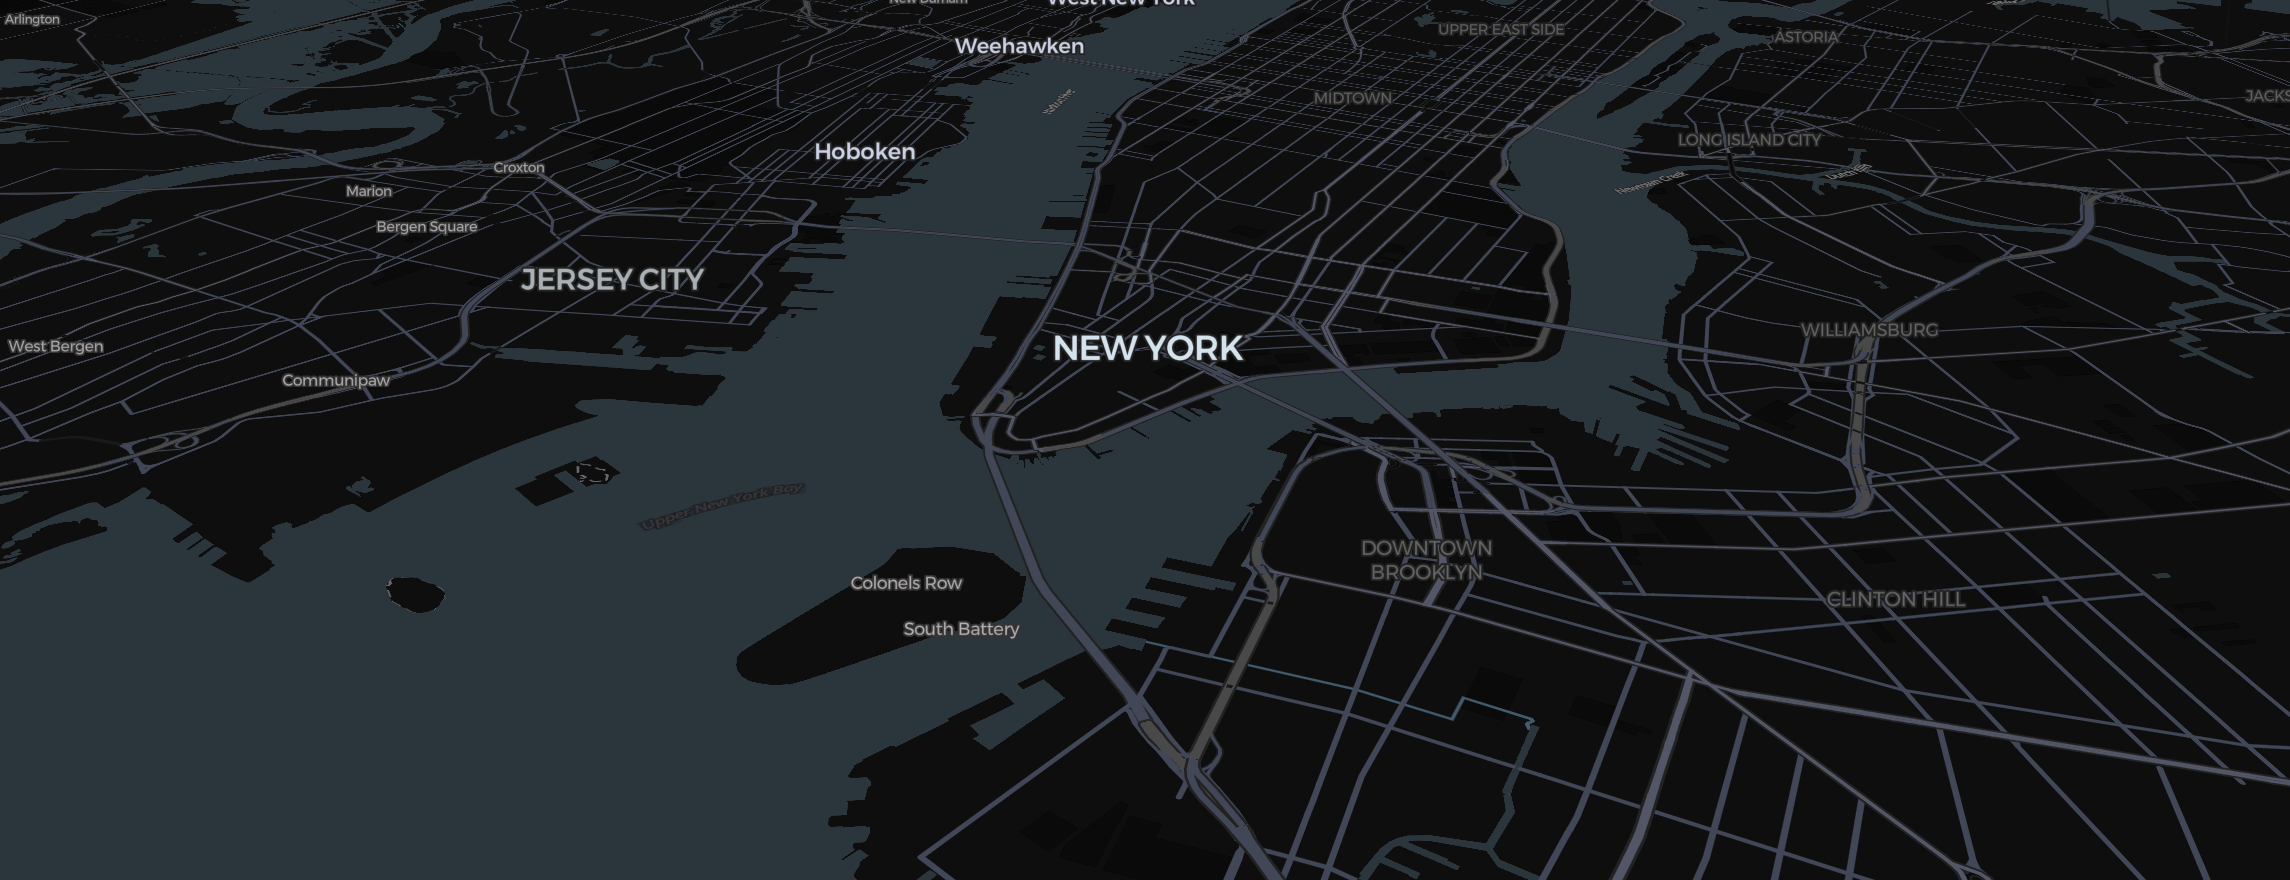
The Middle East is one of the most mapped regions in history, requires high levels of precision and clarity. For journalists and educators explaining current events (like the conflicts in Sudan or Syria), Mapimator offers the tools to build respectful and accurate visuals.
Transparent Tones
Overlapping claims shouldn't look like a mess.
- Use the Region tool (how it works) to select the specific territories.
- Set the fill Opacity to about 30%. This allows the topography to remain visible while identifying who controls which zone.
- Use dashed lines or shapes alongside your regions to signify contested or disputed zones.
Dynamic Labels
Instead of letting the map engine place labels, use text elements.
- Context is everything: Place a label for the capital city (e.g., Damascus) using the Montserrat font for a modern, bold look.
- Halo (Glow): If you're using a dark map style like Dark, add a small Outline Width to your text. This ensures labels are readable even when the camera moves over mountains or forests.
Calm Camera Movements
When discussing sensitive topics, the camera should be steady.
- Use Smooth Easing exclusively.
- Lengthen the duration between slides to 8.0s or more. This prevents the "motion sickness" that can come from rapid zooming and allows the audience to focus on the information.
For the final version, ensure you let the export's map prewarming step finish so that the borders and labels remain sharp for mobile and TV news formats.