
December 21, 2025 · 1 min read
Visualizing Hurricane Paths and Weather Data
How to use Mapimator's 3D engine to map the trajectory of storms and climate patterns.
By Mapimator Editorial#Science#News#Nature
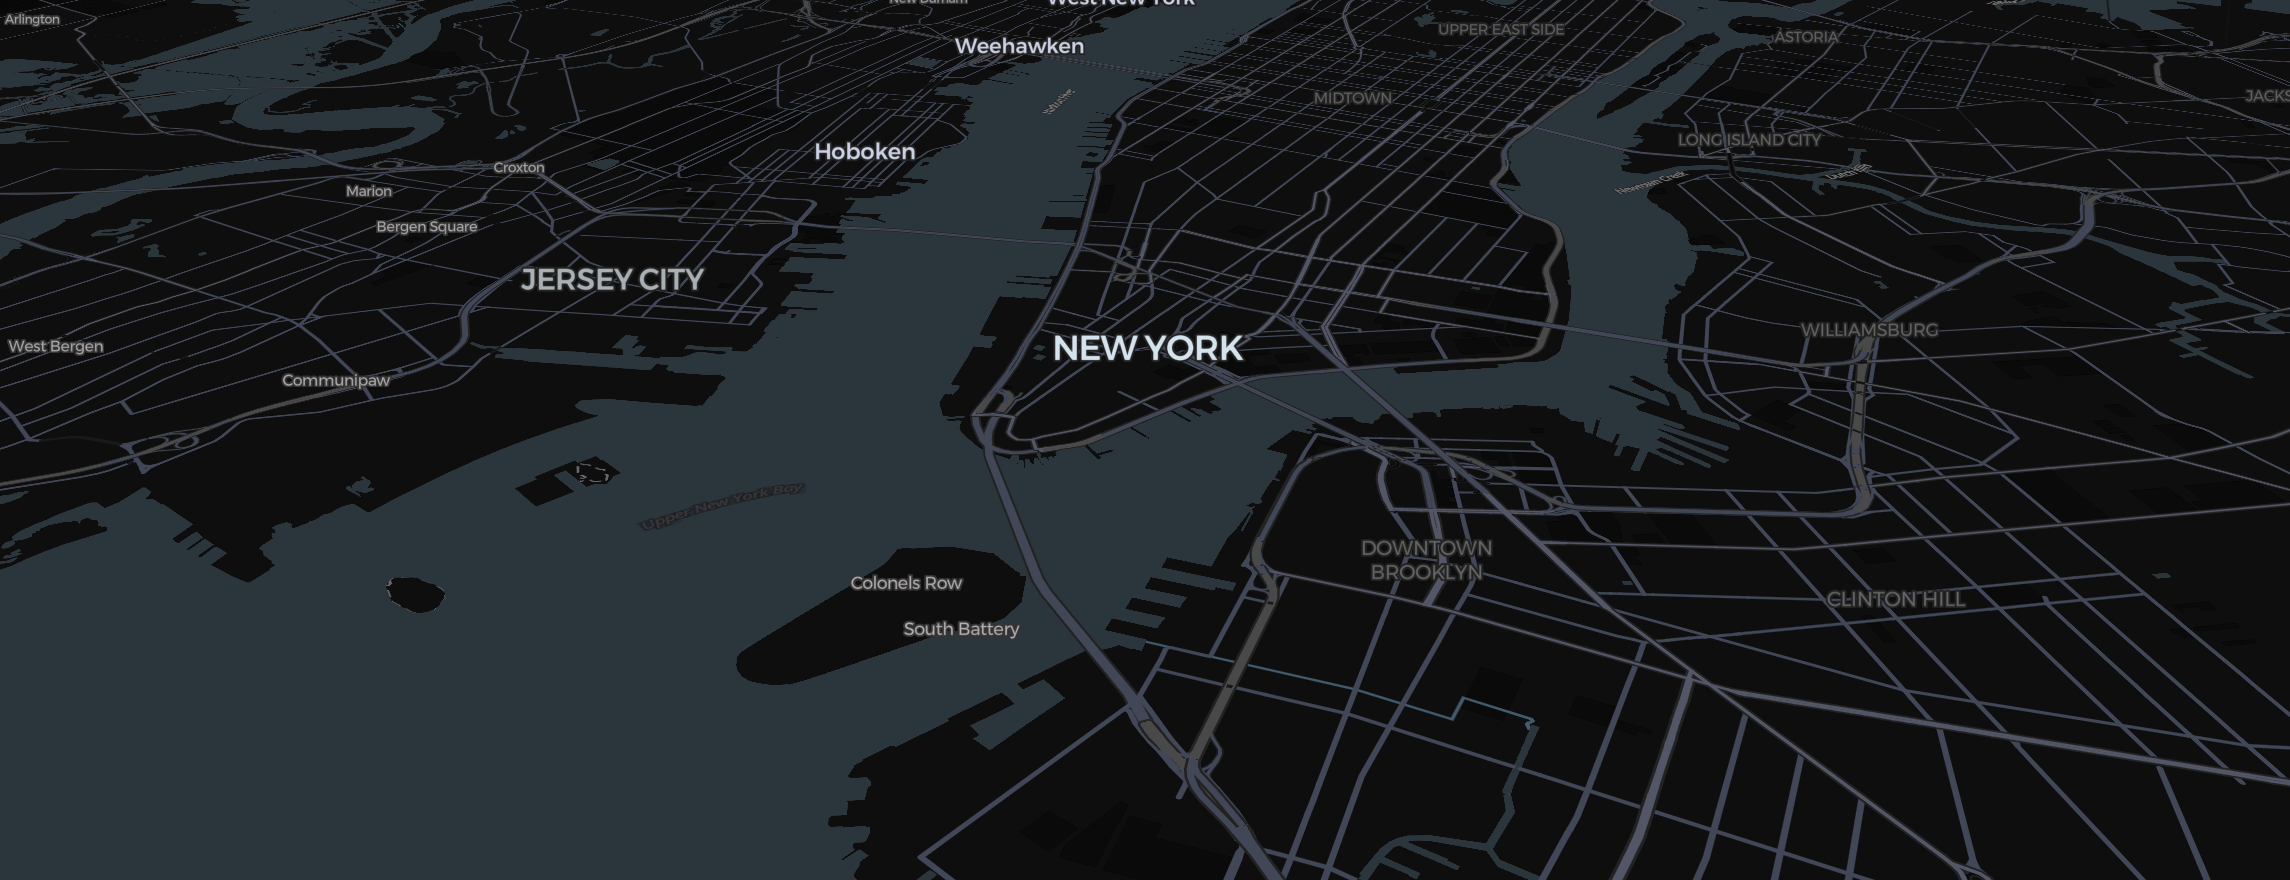
Weather events like hurricanes and tropical storms are inherently geographic stories. For journalists and educators explaining the path of a storm through the Caribbean or across the Atlantic, Mapimator provides a high-contrast 3D canvas for clear data storytelling.
1. Mapping the Trajectory
A hurricane's path isn't a straight line.
- Use the Route Tool in Direct Mode.
- Place waypoints at the storm's coordinates for each day of its progression.
- Set the Stroke Width to be thick and use a vibrant Red or Orange.
- Set the Animation Type to Draw to show the storm’s advance in real-time.
2. Indicating the Cone of Uncertainty
- Use the Shape Tool (Circle) to place a colored circle over each waypoint.
- Use the size controls in the element panel to make the circles larger as the storm moves farther into the future, indicating higher uncertainty.
- Set the fill Opacity to 30% to keep the coastal cities and islands visible beneath the data.
3. Visualizing the Terrain Impact
- Use the Satellite map type to see the realistic textures of the coastline.
- Turn on 3D Terrain under View and pitch the camera (Right Click + Drag) to see the topography of islands like Puerto Rico or Cuba.
- Use Text elements with an Outline to label the storm’s category at each stage.
Professional News Export
Weather news requires absolute clarity.
- Use Linear Easing for a steady, informative camera move.
- Always let the Studio finish its rendering preparation when you export. This ensures that every high-res coastline and storm label is perfectly sharp in the final MP4 (up to 4K on Pro).
With Mapimator, you can turn complex meteorological data into an accessible and compelling news visual.