
December 25, 2025 · 1 min read
Tracking Disease Spread: Visualizing the Polio Timeline
How to use temporal mapping to show the impact of public health interventions over decades.
By Mapimator Editorial#Science#Education#Healthcare
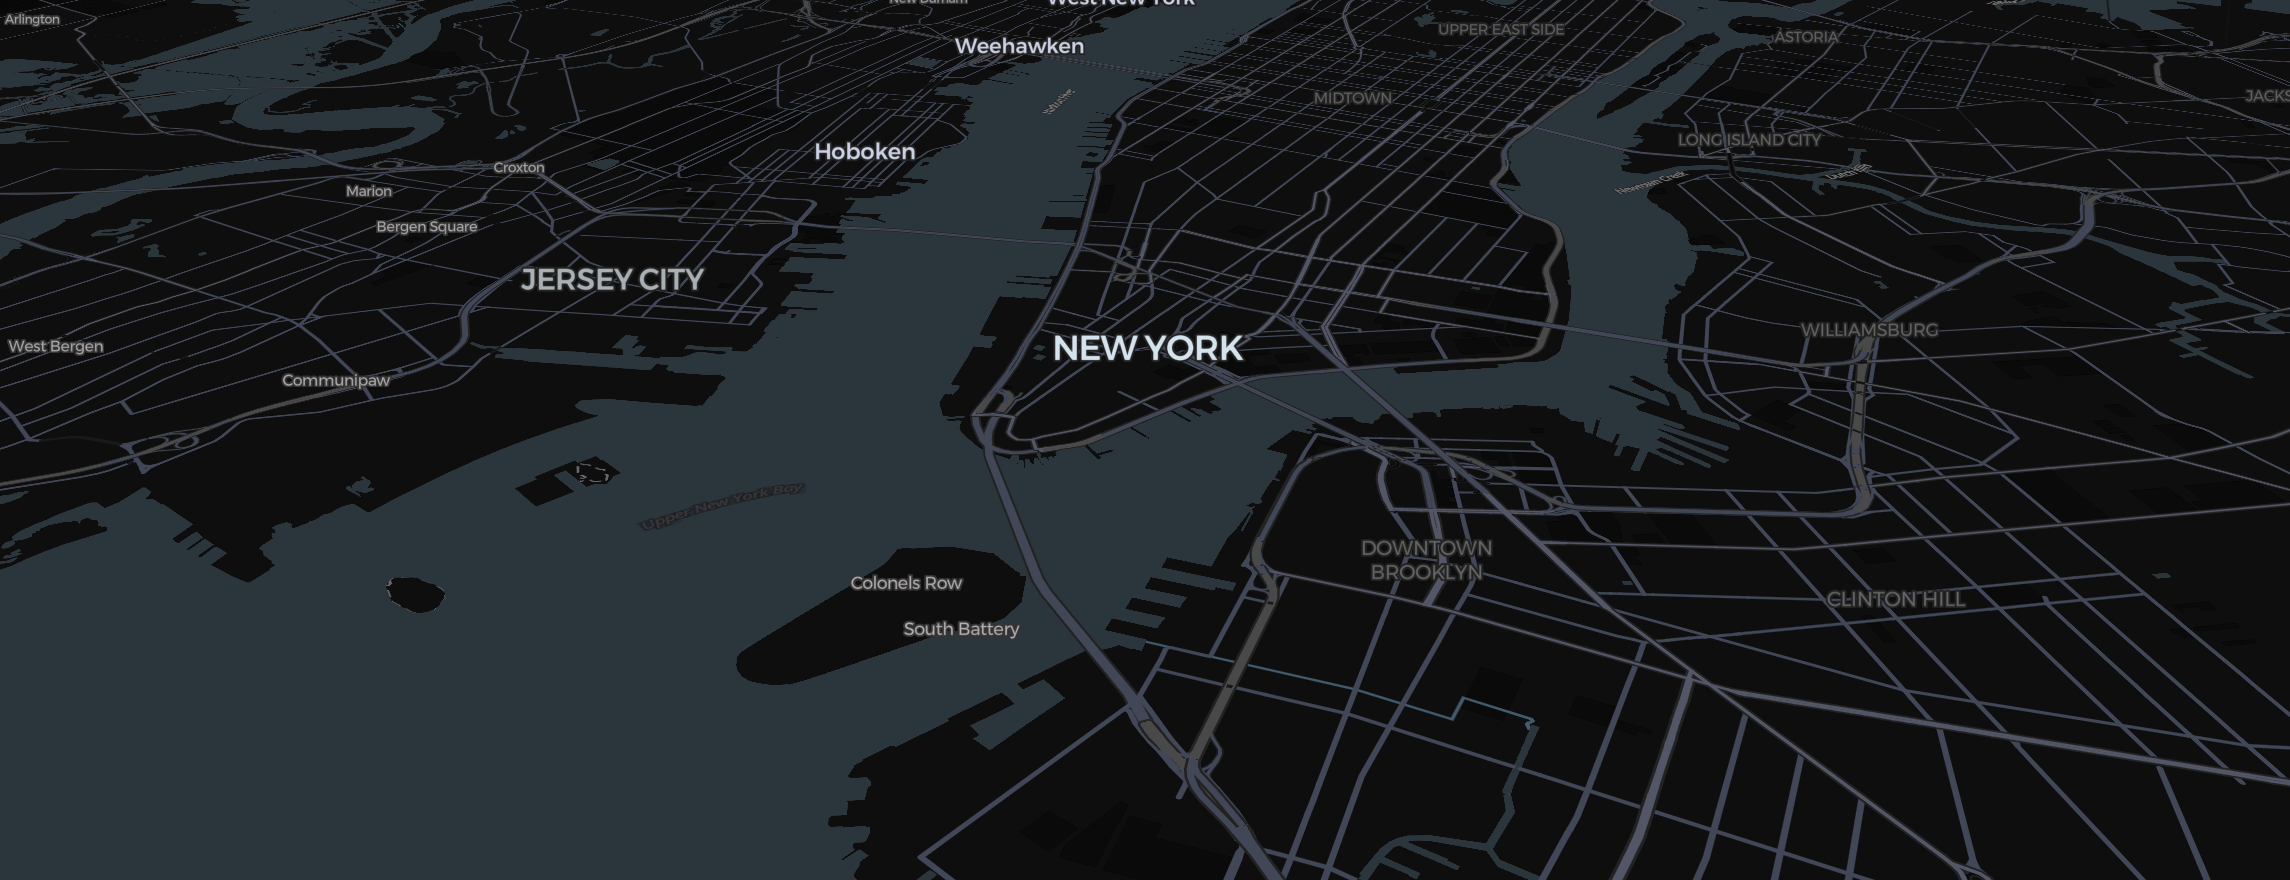
Maps aren't just for travel—they’re for tracking data over time. One of the most powerful uses for Mapimator is visualizing public health successes, like the global efforts to eradicate Poliomyelitis. Here is how to build a dynamic "Temporal Map."
Formatting the Data Visualization
To show disease spread, you need a high-contrast color palette.
- Style: Use the Light map type. This provides a "clean room" aesthetic that lets the data stand out.
- Regions: Use the Region tool to select countries.
- Color Coding: Set the fill Colour to Red for high prevalence and Blue for eradicated regions. Set the opacity to 50% to keep the map readable.
Animating the Timeline
The Slide Cards in your Storyboard act as your years.
- Slide 1 (1950): Large areas of the world are highlighted in deep red.
- Slide 2 (1980): Use the region tool to shrink the red highlights as vaccination programs take hold.
- Slide 3 (Modern Day): Only a few specific districts remain red.
Adding Text and Images
Don't just show colors; explain them.
- Use Text elements to label each slide with the year.
- Add an Image element of the vaccine symbol to indicate the start of major interventions.
- Use Smooth Easing for a steady, calm, and informative pace.
To ensure your data remains crisp for a high-stakes presentation or a classroom lecture, always let the Studio finish its rendering preparation when you export.